
That's not a subsidy... THIS is a subsidy.
The hidden costs of car dependency, and what we can learn for expanding transit


It is the lead-up to the 2023 NZ General Election (or at least was when I started this, consider it a brief escape on election day), and following the release of some new tax policies, talk has touched on land transport costs, particularly the idea that car drivers pay-their-way, unlike - errgh - subsidised public transport users, who are quite clearly bludgers.
But is this idea true?
No.
Driving cars, or ‘car use for person-transport’ is subsidised in New Zealand.
The details as to why and to what extent though, are fascinating. Fortunately, the discourse happens to coincide with me taking an - what some might say - unnatural interest in - what some might call - the dreadfully boring report from the Ministry of Transport, the Domestic Transport Costs and Charges Study (DTCC) 2022.
Some might say that, but not me. It’s full of juice. I love it.
Part 1 of 3: DTCC 2022
Direct public costs and funding
The study puts roading revenues attributed to passenger vehicle users at $2.5b (paid into the National Land Transport Fund NLTF for disbursement by Waka Kotahi), and internalised costs of the roading network attributed to passenger vehicles (including capex for new and improved roads) at $3.1b. That’s an 82% rate of recovery. A definite subsidy then, but admittedly - not too bad.
Where does the rest of the money come from? Subsidies, primarily from local government rates and central government, the former paying for things like local roads, the latter new or “upgraded” state highways.
This arrangement effectively has drivers paying for the operations and maintenance of the state highway network, but not all of the capital expenditure, nor any of the expected return on assets (essentially, the opportunity cost of spent money) for those same state highways. When you consider those factors (economic return on capital) as additional costs - as you would in any business case - users of passenger road vehicles only cover 51% of their $4.9b economic costs.
If we briefly exclude annual capex spending and look only at operations and maintenance of the road network, plus policing, crown schemes, and WK overheads, we get a (fairly rosie) view of the road network, with “full” self-funding achieved - with users contributing $2.5b and costs of only $1.9b: an impressive recovery ratio of 130%.
Interesting to note also that drivers largely do not pay for the local roads within which they do most of their driving. While the total road system is funded, the local roads on on which most of the NLTF revenue is generated (and most of the costly maintenance is required) recieve a disproportionately small fraction of spending from the NLTF. In effect, drivers on local roads subsidise the state highway network, and are in turn subsidised by local councils via rates.
So… If you ignore a big chunk of the costs of infrastructure and various local roads, there is indeed a narrow scope where you could say that driver’s pay their own way.
You might be accused of cherry picking, but still - the direct operational expenditure on the roading network is more than exceeded by user charges.
Public transport
Let’s now compare to public transport. Here we have a total farebox revenue of $360m and internalised economic costs (including capex and cost-of-capital) - borne by the public sector - of $1.3b, for the overall recovery ratio of 26%.
This PT recovery ratio is indeed worse than for driving, so presumably this is where the idea of an expensive, subisidised, weak, (wet, whiny?), public transport system comes from.
However, the roughly $1.9b per annum gross operational expenditure (the public internalised cost), or even the $4.9b capex-inclusive public internalised cost (including costs of capital) represents a fractionally tiny portion of the total ongoing expenditure on road travel for the transport of people.
The private internalised costs, which include the $2.5b that drivers pay into the NLTF, plus the costs of vehicles, fuel, and time driving sums to a whopping ~$57b pa.
Just to be clear, that’s excluding all freight costs.
There are equally phenomenal costs that car drivers impose on society at-large, which everyone (not just car users) have to collectively pay for. These driver-incurred costs are subsidies by society, and sum (net of financial charges to drivers) to about $22b pa.
Private internalised costs for PT? Only $1.1b pa. Externalised? Only $1.5b.
For completeness, here’s a version after dividing by the numer of person-km travelled, to roughly normalise for the different scales of the two modes’ transport task - an necessary step if we’re to consider the impacts of scaling up either mode.
Adjustments needed…
At least… those were the costs at the time the study report was drafted, but the DTCC notes that many of these numbers are due to rise, and in-fact have, by quite a lot!
For instance, the Value of a Statistical Life (VOSL) changed drastically this year from $4.88m to $12.5m. The DTCC used the even lower 2018 value of $4.34m. $12.5m in 2018 dollars (the currency basis for all the numbers in the DTCC report) is about $10.5m. If we want to adjust the costs of car crashes to reflect the updated VOSL, we might multiply the cost of ‘loss of life or permanent disability’ (which is 77.5% of the total cost of accidents involving motor vehicles) by this increase of 2.4x, yielding an extra $5.5b in total costs. In the graphs I’ve split these costs 50/50 over private and social.
In addition, the environmental degradation costs due to air quality are based on a preliminary version of HAPINZ 3.0, which has subsequently been completed and released (and brilliantly summarised) - including an order of magnitude greater damage-cost associated with things like NOx emissions than originally drafted. The DTPP study estimates the effect of this as increasing the severity and extent of harm done from those emissions, changing the total cost (over all modes) from $1.2b to $11b.
If we roughly apportion those increased costs to modes according to their original contribution to the total air quality costs, i.e. 37% for cars (with the balance including things like freight transport, urban buses, and domestic aviation) we can attribute an additional $3.7b to the chemical & particulate pollutants costs for cars, for an updated value of $4.1b. But before we add that back in to our totals, it too needs to be adjusted to account for the updated VOSL - since these pollutants’ costs relate to their effect on human health, in terms of quality-adjusted life years. So multiplying again by the 2.4 we found earlier, we get to $10b (from only $449m) - fully externalised.
Note this uses Table’s 11.3 and 11.4 from the study, which I’m pretty sure are mislabelled, twice… 11.4 should be for air quality pollutants, rather than GHG’s as labelled.
Doing the same thing for public transport yields an additional $1.0b in the costs of ‘loss of life and permanent disability’ resulting from accidents (assuming the same costs-of-accidents breakdown applies to PT as for all motor vehicles), and an additional $0.6m after adjusting for HAPINZ 3.0 air quality damage costs, or as much as $1.5b more (total air quality costs of $1.6b) if you stack the updated VOSL.
If you lost me there, fear not - I have another graph showing costs after these adjustments:
To summarise, that’s now a total gross (i.e. not subtracting user taxes and charges from the public sector expenditure - the numbers change slightly) economic cost for expanding, operating and maintaining the system of cars for the movement of people of $96.1b, with car users paying for (in one way or another) roughly 62% of that - or a 38% subsidy from society.
Normalising again by person-km travelled for each mode…
For whom the subsidy… subs?
So which is more subsidised? Which is more expensive?
Cars have a private/total cost ratio of 62%, i.e. a combined public sector and societal subsidy of 38%. Public transport has a private/total cost ratio of cost recovery rate of 27%, i.e. a subsidy of 73%. Public transport is more subsidised than driving.
The total societal cost for car drivers is $36.4b pa, compared to $3b for public transport. That’s over 10 times as much societal subsidy to car drivers. Driving is more subsidised than public transport.
On a per person-km basis, the total societal cost for cars is $0.62 $/pkt, v.s. 1.19 $/pkt for public transport. That’s 2 times as much societal subsidy for public transport. Public transport is more subsidised than driving.
Considering how well externalised costs are offset by contributions from their users, cars have a ratio of ‘user taxes and charges’ to ‘total social costs’ of 6.9%, compared to 12% for public transport. Driving, again gets almost two times the subsidy of PT. Driving is more subsidised than public transport.
Consider too how well internalised, public costs are offset by charges from their users (i.e. the public internal cost-recovery ratio). For cars this is 56%, while for public transport it’s 26%. Public transport is more subsidised than driving.
Overall costs
Total costs of car drivers is $96.1b pa, compared to $4.1b for public transport. Driving is more expensive than public transport.
On a per person-km basis, the total costs of car drivers is $1.65/pkt, compared to $2.50/pkt for public transport. Public transport is more expensive than driving.
On a per-person-km bases, the direct user-costs for car drivers are $1.02/pkt, v.s. $0.69/pkt for public transport. Driving is more expensive than public transport.

I could go on - the point is you could slice these numbers any which-way to tell a given story - though not all stories are equally useful for informing robust public policy.
Part 2 of 3: Mode scalability
To me, the thrust of the criticisms around high rates of subisidy for public transport centre around its scalability as a transport mode. And that’s a fair question!
Is mode-shift desirable, from an economic perspective?
Social costs in particular are problematic - these are costs incurred by people making decisions, imposed on people who never agreed to pay. Not to mention who suffers externality costs is inequitably distributed (e.g. the young, aged, disabled, poor, etc).
So is mode-shift desirable, from an economic perspective?
It’s clear to anyone who has lived in a car-dependent city that driving - as a mass transit solution - has enormous social and private costs in aggregate. From the DPCC report - especially after some adjustments are made - we see that there are also large (per-person-km) social costs associated with our existing public transport system.
However, if we’re to improve our cities from here, we have to consider if these costs necessarily scale with the transport task. From our graphs alone, it seems very clear that if public transport were to be scaled up by an order of magnitude, we’d need to do something about these unit costs! Can they feasibly be reduced, as PT use and services grow?
Let’s break it down. Recall the adjusted cost rate chart from earlier? Two big costs jump out for PT; air quality and public sector expenditure
How do air quality damage-costs scale with PT?
Aside from the public sector spending, fortunately, the large social cost for PT is overwhelmingly due to vehicle air quality impacts, which do not scale with the size of the public transport task (unless your city tries to rest its whole PT task on a service with ruinous scalability… looking at you, Timaru).
Air quality pollutants are readily prevented in public transport, especially as it scales to true mass transit.
Rail-based modes like light rail, suburban rail or metro rail systems shed (not shred), the rubber tyres - mostly responsible for PM2.5 particulate emissions - present on even the newest and most fashionable battery-electric buses (or god-forbid, trackless trams). Urban rail systems (as well as other electrified modes) also eliminate the tailpipe emissions of the predominantly diesel bus fleets operating on current PT networks.
…the air quality cost rate for PT would also drop by an order of magnitude… halving the social cost rate for PT
If these two pollutants can be largely eliminated from future transit expansions, and those expansions led to an order of magnitude higher transit usage, the air quality cost rate for PT would also drop by an order of magnitude - going from something like $0.96 to ~$0.10 per person-km, basically halving the social cost rate for PT.
To be clear, diesel buses and especially electric buses aren’t bad - they are vital for effective, layered PT networks and will continue to be for the forseeable future - and even on-demand services could form a useful part of the transport mix (though how these differ from a simple subsidised taxi is beyond me), but we would start to see some significant environmental problems if we scaled their VKT up by an order of magnitude or two.
As for the other PT modes; ferries are a massively outsized source of PT pollutants due to diesel engines, but luckily these vehicles make up a very small proportion of the overall PT network, and electric versions are becoming more common. Long-distance rail is also currently a very small proportion of the overall transport task, which buys a lot of headroom for growth in services from the current, embarrassingly dismal nationwide count of two, before expensive network-wide electrification is neccessary.
How does public sector spending scale with PT?
At $0.81 per person-km-travelled, the per-person-km public sector subsidy sits at a phenomenal rate - about 10 times higher than for cars. Would it hold if we were to scale up public transport PKT?
It depends.
Firstly, to be clear - this large rate of public sector subsidy is not due to an excess of funding (cars benefit from total public sector spending which is 3 times greater than that for PT), but rather a very low transport task (about 35 times less PKT than cars).
This low transport task is not inevitable with scaled up PT, so long as that future network can attract mass ridership.
Achieving mass-ridership
While progress is being made (maybe a topic for another article), most of our existing public transport system is designed to serve as a last-resort, only-use-it-if-you-have-to transport mode. The services are generally slow, infrequent, and unreliable, and, where there are rare exceptions - such as the urban rail networks of Wellington and Auckland - long-term service suspensions are often sprung on travellers, forcing people to maintain alternative options. If that alternative involves stumping up cash to buy and maintain a private car, they’re likely to use it even if their public transport connections are normally (but occassionaly intolerably not) sufficient.
PT is often thought of in New Zealand as an option for those who can’t (or can’t afford to) drive. And of course it is, but it also has to be for everyone else too if we’re to expect it to be economically efficient. You have to put the mass in mass transit.
What attracts people-who-have-options to transit? While comfort and usability - if done badly - will put people off, getting those things right is just a bare minimum for maintaining patronage. Why most people choose a given mode - if we’re to believe the economists - is because it’s in their private interests to do so.
From our charts at least, we know the private economic benefits for PT users consist of only two things:
relatively low user charges, and
any available travel-time savings.
Those user charges for PT ($0.22 per person-km) are already lower than the total financial cost to users of cars ($0.40 per person-km). They’re probably already low enough to have negligible effect on average ridership if further reduced (it would be great to dig into the half-price fare period to see how true this is. If memory serves, it helped increase patronage on Te Huia a lot, but urban bus services not-so-much). This isn’t to say more fare subsidies shouldn’t be offered to targeted groups or for specific services, and there may be improvements in usability for zero-charge services which provide a modest bump in ridership, but user charges do contribute a significant amount of the overall funding for PT.
The only other private user-cost is time.
The DTCC study our charts are based on likely under-estimates this since it doesn’t consider whole journeys, only trips while on the PT service. That means time spent walking to a stop or station, time waiting for your next service to arrive, or time transferring between services isn’t counted here. Neither are cancellations, or having to go out of your way to cope with closed lines you normally rely on. If these were counted, the overall private costs to PT users would be significantly higher - potentially still so high for most trips that even free ticketing wouldn’t offset the time costs of PT enough to make it a compelling option.
All of these time-costs can be minimised for PT users, by careful network design and respect for operational reliability, sensible mode choices, and urban planning. Things like turn-up-and-go frequencies, transit hubs, active-mode cut-throughs, bike carriage on PT vehicles, congestion-free routes, high average speeds, short station dwell-times, all-door boarding, pro-active maintenance, contingency planning, resilient networks, and so on. These are all well understood by public transport experts, but translating this knowledge into public transport operations is a (very) challenging political task.
Urban form
The last factor I’ll touch on as part of the cost structure of public transport is urban form.
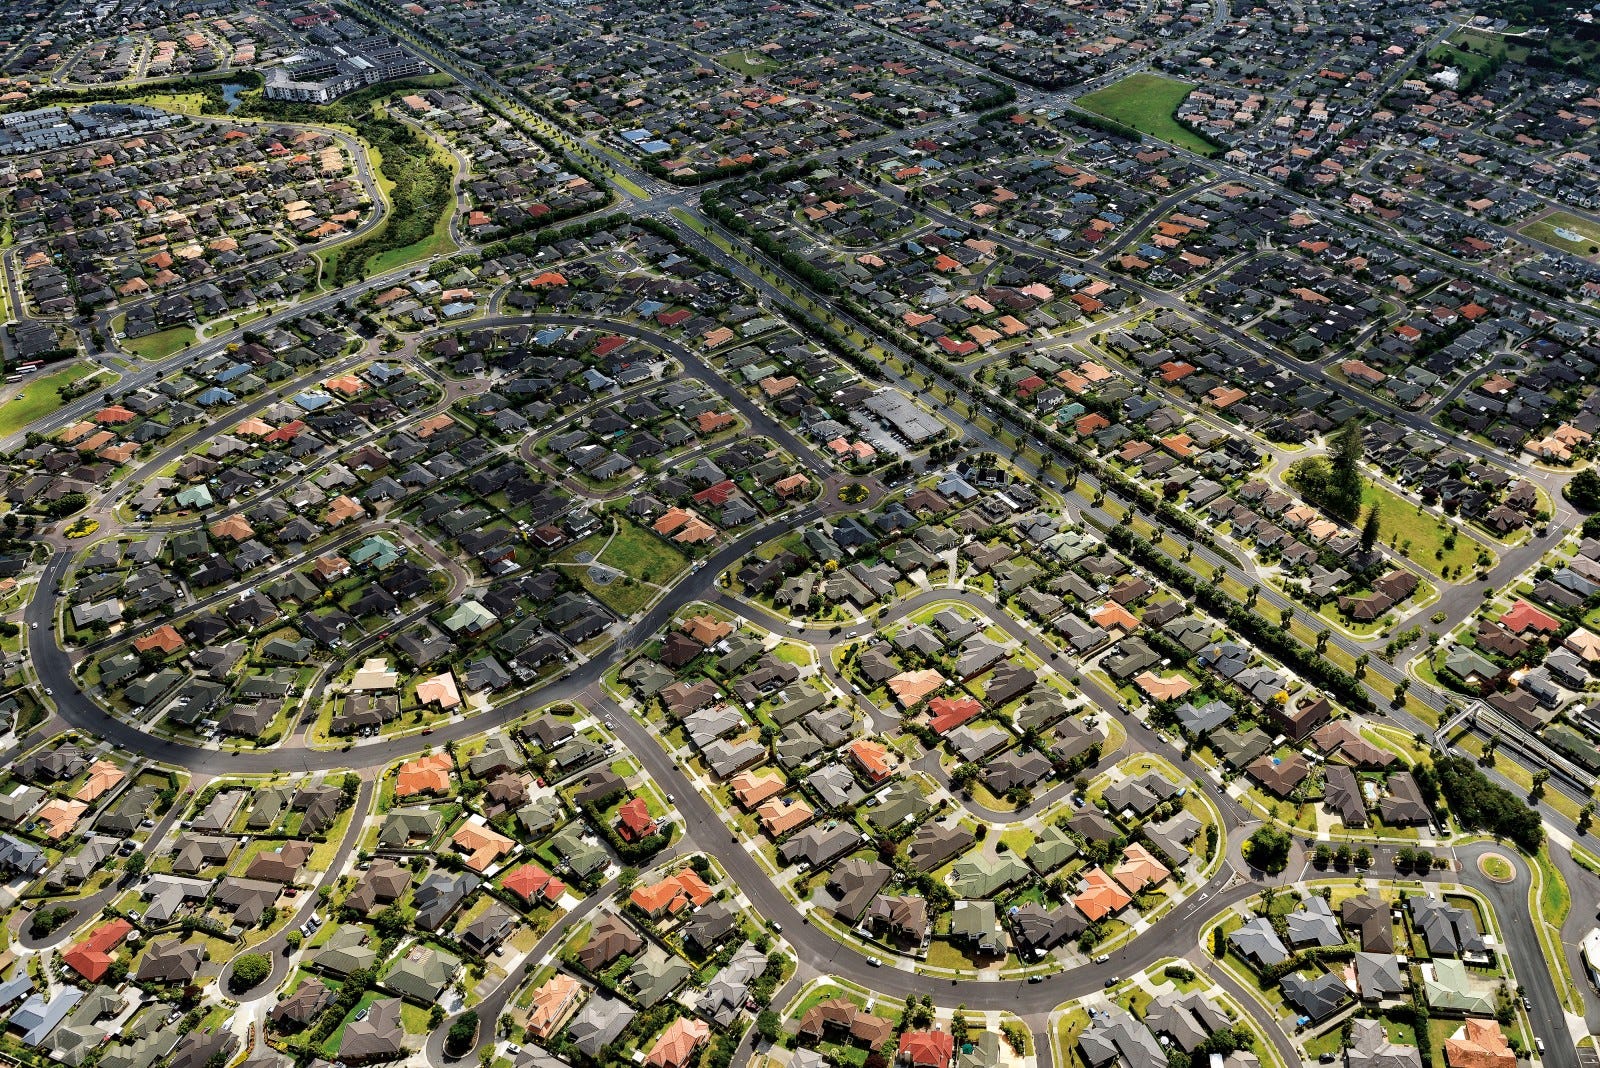
For the last half-century we’ve designed built large parts of our urban transport networks into a mix of sprawling, torturous roadways serving exclusive-usage housing and business densities that are low enough to accomodate 80 cars for every 100 people, and enormous limited access motorways cutting through otherwise vibrant business and residential districts. While the DPCC report considers the economic cost of parking provision, there are other costly impacts stemming from car-oriented development.
These relatively recent city redesigns - in many cases, though not all - necessitate economically inefficient public transport services - either forcing surface (read: cheap) lines to take long, slow routes with low catchments, or else be forced to stump up massive cash for road-widening or grade-separated rights-of-way. In many cases these latter options are chosen despite linear surface routes being available, as a kind of bleak sacrifice to the sacred traffic lane gods.
And transit isn’t the only infrastructure that becomes largely uneconomic to deliver in such a car-dependent low-density urban form. Huge bills for sprawling three waters infrastructure are busy crippling local authorities’ finances. These costs might have been substantially reduced per-ratepayer had our urban centres been allowed to densify and infill - spreading maintenance and upgrade costs over more residents per unit area. This isn’t transport infrastructure per se, but while the DPCC report captures economic costs associated with direct impacts of the driving system, it fails to account for this and other aggregate impacts of land-use changes that system necessitates. These additional social costs are kinds of indirect subsidies for car travel, which are both historical and difficult to quantify.
We’re not about to rip out these developments - many of their costs are sunk - but it’s important to consider both how they have progressively tipped the scales over the last half century, and how their per-person costs might be minimised as our cities grow.
A couple things are clear - that if we want to reduce the public sector subsidy rate for public transport as it scales,
we have to get excellent long-term value for money in PT projects,
we have to provide services and networks that offer a compelling private cost benefit over alternatives (i.e. be appealing to users), and
we have to strategically plan our land-use patterns to compliment these objectives, as they have large indirect economic co-benefits.
The financing of transit, and indeed of cities, could be quite straightforward - with average user cost-recovery (fare prices) able to increase in-line with private benefit to users, and things revenue streams from non-user beneficiaries also helping to cover the costs. These revenue streams could include things like congestion charging car drivers who benefit from relieved congestion, and/or things like targetted rates or development contributions from nearby property owners who see increased land-values via things like increased commercial activity, more intensive permitted land-use, better connectivity and desirability.
It should also be clear that broadly used mass-transit services are very hard to economically retrofit without these kinds of broader financing mechanisms (and/or external subsidy and/or free-passes on externalities), which are generally only available to government authorities, or companies in possession of vast tracts of land procured by 1800’s railway tycoons - not your typical corporate entity.
Part 3 of 3: Moving forward
To summarise:
Car travel is subsidised at a high total cost
Public transport is subsidised at a high unit rate
It’s feasible to reduce the unit costs of public transport as it scales up its transport task
Mode-shift from car to public transport has feasibly large co-benefits
It’s feasible that, if we were to scale up PT, the total transport cost rate could be lower than we have with the status quo mode-split. If non-transport co-benefits are also considered, this total cost rate saving could be even larger.
We haven’t explored the counterfactual:
Is it feasible to meaningfully reduce the unit costs (from both direct and indirect costs) of car driving, especially if it were to scale up its transport task?
While there are always automobile technologies arriving which help achieve this (EV’s being one of the more significant examples), the crux of the problem is A: whether these technologies are realistic and feasible at ever-increasing scale, and B: how fully quantified any externalities (including non-transport co-benefits/detriments) are.
Cars don’t (though it pains me to say) necessarily lose this contest. They offer an incredible amount of mobility, and benefit from generations of investment in technology and city planning to make them as close to optimally economically efficient as might be possible for what is fundamentally a spatially inefficient mode. They still kill a lot of people and en masse ruin cities, but we’re just talking economics here!
The corollary: public transport doesn’t win the economic contest by default either.
For example, we can’t afford to simply scale up our fleets of diesel buses without improving their public sector, private, and social cost structures. Equally, we can’t afford to squander 10’s of billions on single urban lines (unless there are critical strategic reasons, or other yet-undisclosed, mind-blowingly high benefits), when there are more useful (for the $) transit projects either not being planned, or biding their time for funding commitments and political drive required for ambitious change.
The challenge any transport & land-use stakeholders (read: everyone) have is to navigate the goldilocks zone between the two - while acknowledging that any one project can only deliver a single step towards an all-of-system economic goal, and that a purely economic argument is blind to other important aspects like justice and inequity.
For me then, the answer to our question (is increasing PT mode share economically and financially desirable) is: Yes, if we build and operate useful public transport networks, using socially sustainable systems, with complimentary land-use regulations.
Would love to know your answer though, because mine’s… kind of wordy.
Greart article, nicely nuanced!
As briefly discussed in our twitter chat, I think the PT figures are quite different when looking at specific cities (Auckland, Wellington) to when you just look at the national average. Given most of our planned improvements are in the cities where the numbers look better, that will help.
Personally I can't help but feel that the lower cost public transport improvements in our urban centres is where the best bang for buck is: increasing bus frequencies, installing bus lanes everywhere, and improving shelters/access/vehicles/information. Combining this with upzoning all along these corridors has got to be a winning strategy. (i.e. do PT Futures and Plan Change 14)
Possibly just a slightly different way of saying the same thing as you.
Interesting read. Surprised how poorly public transport did in the pkt comparisons. Did the costs for cars include the cost of "free" parking all over our cities?